Realtime visual profiler
Introduction
When building a game engine it can be difficult to keep track of what your code execution looks like and where time is being spent in your game, especially if it's running on multiple threads. That's why I wanted to make a tool to measure performance in our engine.
Collecting data
There are several ways you could collect your data, but all of them include starting and stopping a timer. I wanted to make adding this timer as easy as possible to enable the use of the tool throughout our codebase. Another requirement I had was to allow the collection of data to be turned off when building and releasing the game.
The idea to time the code was simple: create a stack-allocated object at the top of the current scope, push the current time on construction of the object to a stack, and in the destructor, pop the top of the stack and record the time it took from construction to now.
This works well for several reasons. One benefit of using an object with a destructor is that the destructor is guaranteed to be called when the object goes out of scope. Another benefit is that as long as the object is the first to be created, it will always be the last one to be destroyed, as objects in C++ are destructed in reverse construction order. This means that any possible destructors of objects we want to include in our timings will get captured as well.
                         Using functions

void Foo()
{
    StartTimer();

    std::vector<int> allocatedData{1,2,3,4,5};

    if (rand() % 100)
    {
        return; // Timer not stopped
    }

    StopTimer(); // vector destructor not included
}
                         Using a scoped object

void Foo()
{
    TimerObject timer;

    std::vector<int> allocatedData{1,2,3,4,5};

    if (rand() % 100)
    {
        return; // Timer stopped after vector destructor
    }

    // Timer stopped after vector destructor
}
The macro
I decided to utilize a macro to generate information like a unique name, the current function name and line numbers for the object. Macros are great for this purpose, as they can easily be turned off to completely remove any trace of our profiling. MSVC has the __FUNCTION__ macro which I will use. This macro is replaced with a formatted string of the current function name during preprocessing. It would be possible to use __func__ as well, however, it does not include namespace or class names.
class ProfileScope
{
public:
    ProfileScope(const char* aFunction, const char* aFile, unsigned int aLine);
    ~ProfileScope();
    ProfileScope(const ProfileScope&) = delete;
    ProfileScope(ProfileScope&&) = delete;
}

#define MYS_PROFILE_SCOPE(NAME) UNIQUE_NAME(NAME, __FILE__, __LINE__)
#define MYS_PROFILE_FUNCTION() MYS_PROFILE_SCOPE(__FUNCTION__)
Thread safety
One of the goals of the profiler was to allow you to collect data from any number of threads simultaneously. This has to be done in a cheap manner to influence the time code takes to execute as little as possible, after all, we don't want our results to change when measuring it.
As the main thread needs all threads list of timings after the frame to visualize them, they somehow need to be stored in a shared container. I use a simple vector where the thread's ID is an index to its local list of timings. This id needs to be small enough to be used as an index, so using std::this_thread::get_id was not possible. My solution instead was to write my own simple thread ID function.
ThreadID GetCurrentThreadID()
{
    static std::atomic_uint32_t nextID = 0;
    static thread_local ThreadID currentID{ nextID++ };
    return currentID;
}
The ids will now start at 0 and increase to the number of used threads. The atomic variable will ensure that no threads can increment the nextID variable at the same time.
Currently, our list of timings looks a little like std::vector<std::vector<TimingResult>>. If we encounter a thread whose ID is larger than the current size of the array, the array would need to be resized. This operation also needs to be thread-safe. Below is the helper I use to get the current thread's timing results. It implements a simple spinlock.
std::vector<TimingResult>& ProfileData::GetResultsFromThreadID(ThreadID anID)
{
    static std::atomic_bool getting = false;

    while (getting.exchange(true));

    if (anID.id >= myThreadResults.size())
        myThreadResults.resize(anID.id + 1);

    getting.store(false);

    return myThreadResults[anID.id];
}
However, there is still a problem. If another thread resizes while we are using our returned vector, the vector would be moved in memory and the reference would become invalid. My solution to this is to allocate memory on the heap for the vector using a unique_ptr. This has the added benefit that if we have returned once, we can store a reference to the vector as a thread_local, which means we never have to lock on that thread again. Making this system almost lock-free.
Conclusion
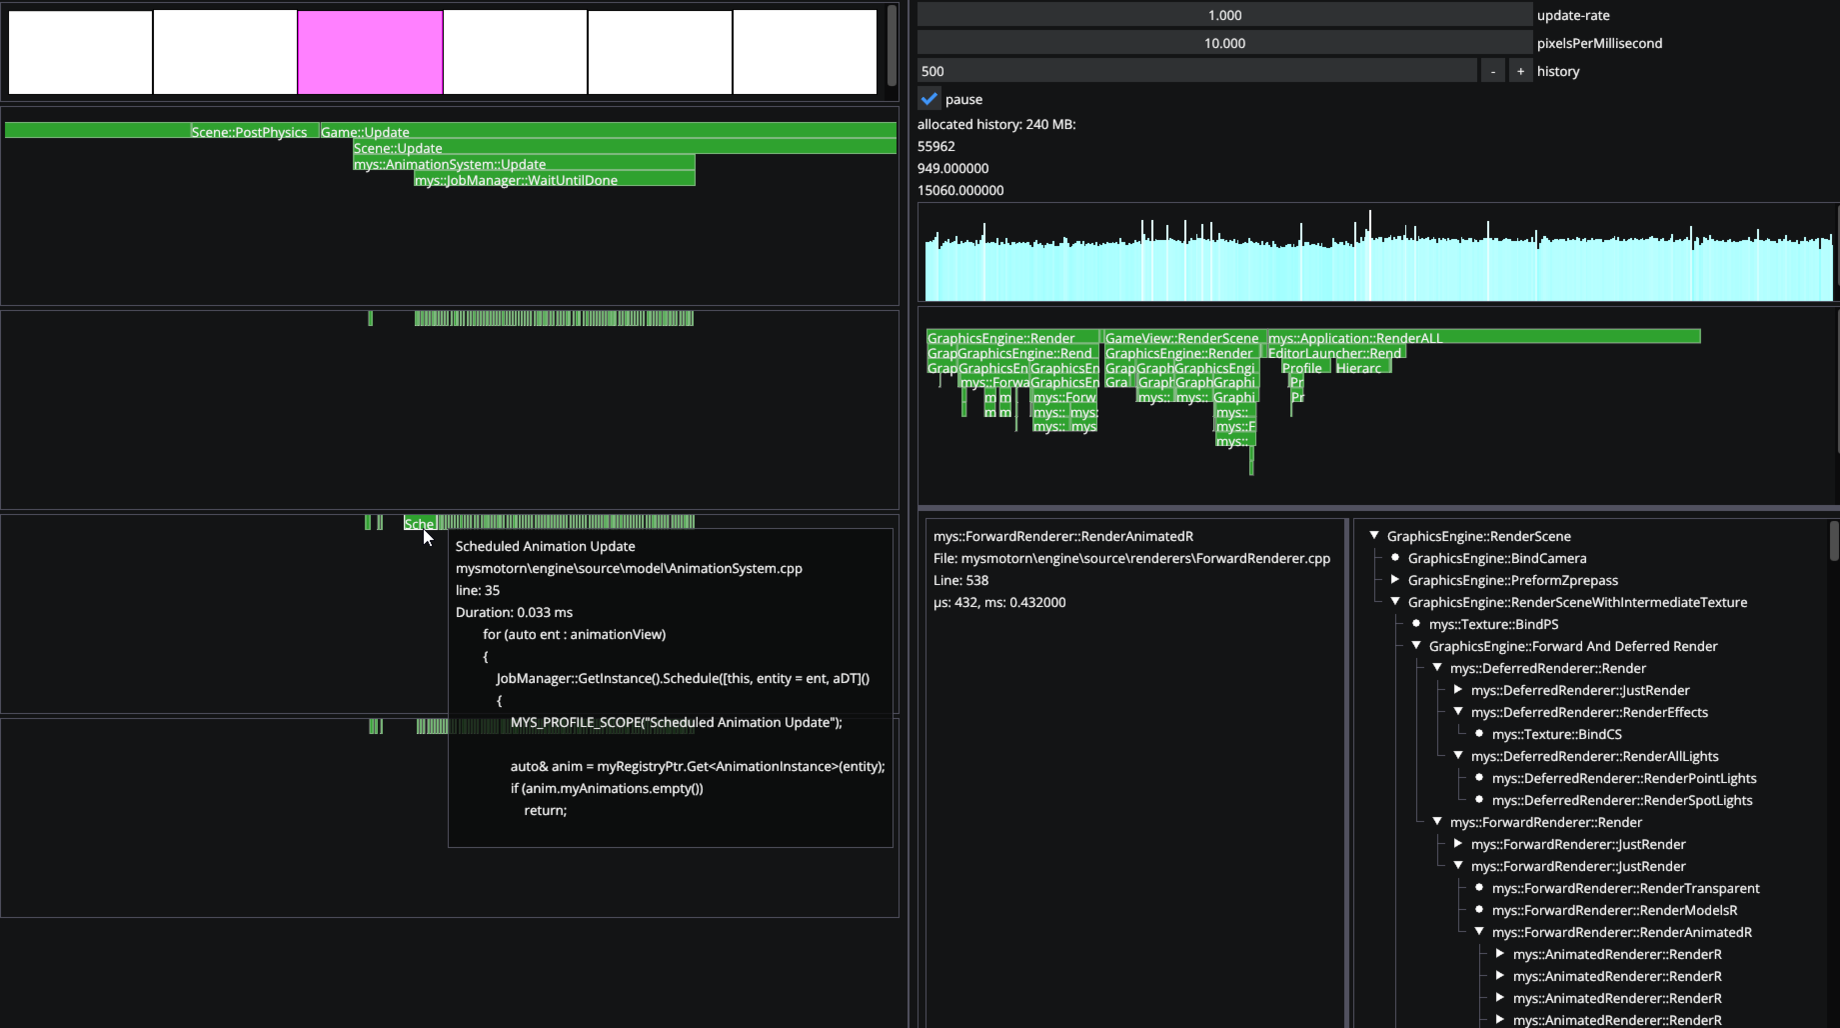
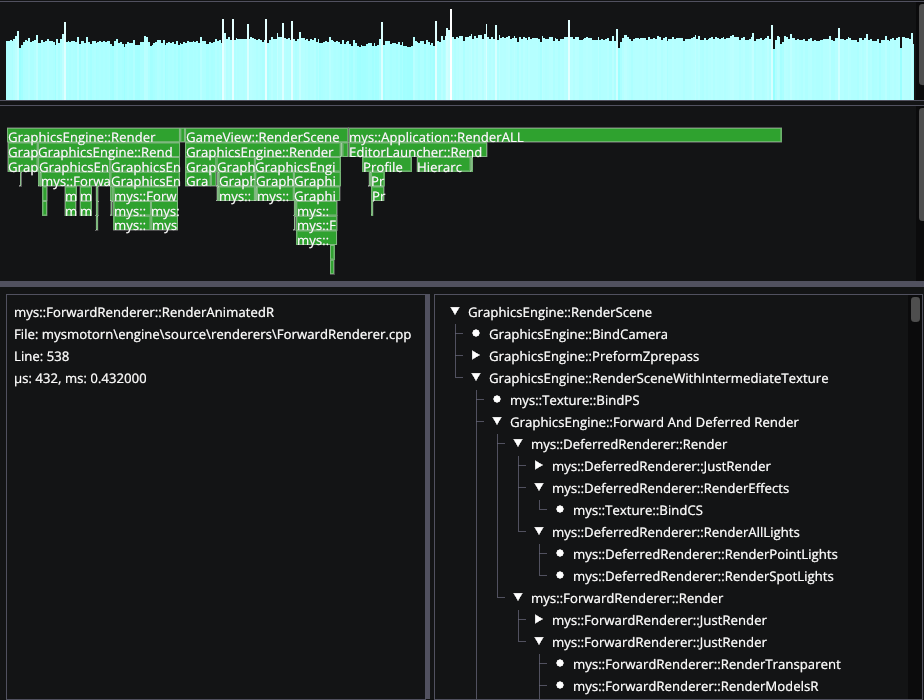
We now have all the parts necessary to use this data and visualize it as we please. I used Dear ImGui's drawlist to render all collected data in our engine's editor. The tool has so far been useful on multiple occasions by other group members to find and resolve performance bottlenecks in our codebase.
Overall, I'm very pleased with how the profiler turned out. There are however some areas I would like to improve given more time, for example the ability to sum the duration of all functions for a given type or saving/loading the history of frames to disk.